You hear them mentioned constantly on broadcasts and baseball websites: WAR, wOBA, FIP, OPS+. These acronyms represent the shift from traditional baseball statistics to a more analytical approach known as sabermetrics. Coined by baseball writer and statistician Bill James (from the Society for American Baseball Research – SABR), sabermetrics is essentially the objective analysis of baseball through statistical evidence.
But what does that really mean, and why has it taken over the game? Let’s break down the core ideas and some key stats.
Why Sabermetrics? The Limits of Traditional Stats
For decades, baseball evaluation relied heavily on stats like:
- Batting Average (BA): Hits divided by At Bats (H/AB). Simple, but treats all hits equally and ignores walks.
- Runs Batted In (RBI): Measures how many runners a batter drives in. Highly dependent on teammates getting on base ahead of the hitter (opportunity).
- Pitcher Wins (W): Dependent on run support from the offense and bullpen performance. A pitcher can pitch brilliantly and get a loss, or poorly and get a win.
- Errors (E): Only measures plays a fielder fails to make, not the plays they do make (range) or don’t even get to.
Sabermetrics emerged from the desire to find more accurate ways to measure player value, isolate individual contributions, and predict future performance by stripping away some of the contextual noise inherent in traditional stats. The goal: find objective answers to baseball questions.
Key Sabermetric Concepts & Stats Explained
Here are some of the foundational and most commonly used advanced stats:
Offense: Measuring Run Creation
- OBP (On-Base Percentage):(H + BB + HBP) / (AB + BB + HBP + SF)
- What it Measures: How often a player reaches base per plate appearance (excluding certain situations like catcher’s interference).
- Why it Matters: Getting on base is the prerequisite to scoring runs. OBP recognizes the value of walks and hit-by-pitches, unlike batting average. A high OBP means a player avoids making outs, a crucial skill.
- SLG (Slugging Percentage):Total Bases / At Bats (Total Bases = 1 for 1B, 2 for 2B, 3 for 3B, 4 for HR)
- What it Measures: The average number of bases a player records per at-bat.
- Why it Matters: It weights extra-base hits more heavily than singles, reflecting their greater impact on run-scoring potential. It measures power output better than batting average.
- OPS (On-Base Plus Slugging):OBP + SLG
- What it Measures: Combines a player’s ability to get on base (OBP) and hit for power (SLG) into one easily digestible number.
- Why it Matters: While not perfect (it weights OBP and SLG equally, though OBP is arguably slightly more important), OPS is a simple and widely used metric that provides a good overall snapshot of offensive production. An OPS over .800 is generally considered good, over .900 is great, and 1.000+ is elite.
- wOBA (Weighted On-Base Average):(More complex formula assigning different weights to walks, singles, doubles, etc.)
- What it Measures: A more precise version of OBP/OPS. It assigns weights to each offensive outcome (single, double, HR, walk, etc.) based on their actual run value. Scaled to look like OBP for easier comparison.
- Why it Matters: It accurately reflects that a home run is worth significantly more than a single in terms of run expectancy. Considered one of the best single metrics for evaluating overall offensive contribution per plate appearance.
- wRC+ (Weighted Runs Created Plus):
- What it Measures: How many runs a player creates compared to the league average, adjusted for park factors and league context. Scaled so 100 is exactly league average.
- Why it Matters: A wRC+ of 120 means the player created 20% more runs than the league average hitter, after accounting for their home ballpark and the overall offensive environment that year. It’s a comprehensive rate stat for hitting.
Pitching: Isolating Pitcher Performance
- WHIP (Walks and Hits per Inning Pitched):(Walks + Hits) / Innings Pitched
- What it Measures: How many baserunners a pitcher allows per inning.
- Why it Matters: A simple measure of how often a pitcher puts runners on base. Lower is better (below 1.20 is generally good).
- FIP (Fielding Independent Pitching):(Formula based on HR, BB, HBP, K, and IP)
- What it Measures: Estimates a pitcher’s ERA based only on outcomes they have the most control over: strikeouts, walks, hit-by-pitches, and home runs. It removes the influence of the defense behind them. Scaled to look like ERA.
- Why it Matters: Traditional ERA is heavily influenced by the quality of the defense (turning balls in play into outs). FIP aims to isolate the pitcher’s true skill level by focusing on events that don’t involve fielders (except for home runs). A FIP significantly lower than ERA might suggest the pitcher has been unlucky; a FIP higher than ERA might suggest they’ve been lucky.
- xFIP (Expected Fielding Independent Pitching):
- What it Measures: Similar to FIP, but it normalizes the home run rate to the league average based on fly balls allowed. Assumes a pitcher’s HR/FB rate will regress to the mean over time.
- Why it Matters: Tries to further remove luck/variance by standardizing the often volatile home run component of FIP. Often considered more predictive of future ERA than FIP or current ERA.
Defense & Overall Value
- DRS (Defensive Runs Saved) / UZR (Ultimate Zone Rating) / OAA (Outs Above Average):
- What they Measure: Complex metrics attempting to quantify a player’s defensive value in runs saved (or prevented) compared to an average player at their position. They use batted ball data, positioning, and play-by-play information.
- Why they Matter: Provide objective ways to measure defensive skill beyond errors, accounting for range and efficiency.
- WAR (Wins Above Replacement):
- What it Measures: Attempts to sum up a player’s total contribution (hitting, baserunning, fielding; or pitching) into one number representing how many more wins that player provided compared to a readily available “replacement-level” player (like a minor leaguer called up).
- Why it Matters: It’s the ultimate “all-in-one” stat, aiming to put players on a single value scale across positions and eras (though comparing pitchers and hitters directly is still tricky). Different sites (FanGraphs – fWAR, Baseball-Reference – bWAR) calculate it slightly differently, but the concept is the same. A WAR of 2+ is considered a solid starter, 4-5+ is All-Star level, and 8+ is MVP caliber.
The Impact: Moneyball and Beyond
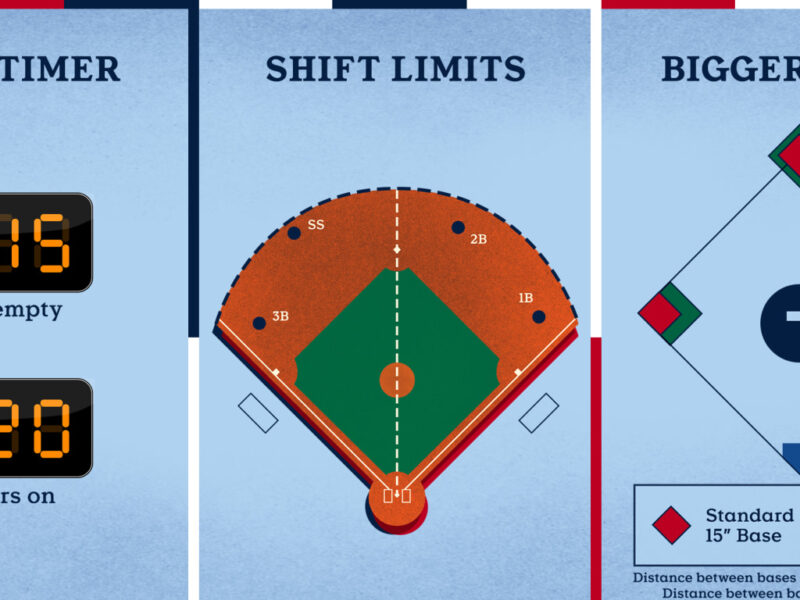
Sabermetrics gained mainstream fame with Michael Lewis’s book Moneyball, detailing how the early 2000s Oakland A’s used analytical principles to compete with richer teams by identifying undervalued players (often those with high OBP). Today, every MLB team employs large analytics departments. Sabermetrics influences player acquisitions, in-game strategy (defensive shifts, bullpen usage), player development (optimizing launch angles, pitch design using spin rate data), and how fans understand the game.
It’s not about replacing scouting or the “eye test,” but rather about adding objective data to make more informed decisions. Understanding these basic concepts can help you see the game through a new, more analytical lens.
What sabermetric stat do you find most useful or interesting? Are there any that still confuse you? Let’s discuss in the comments!